
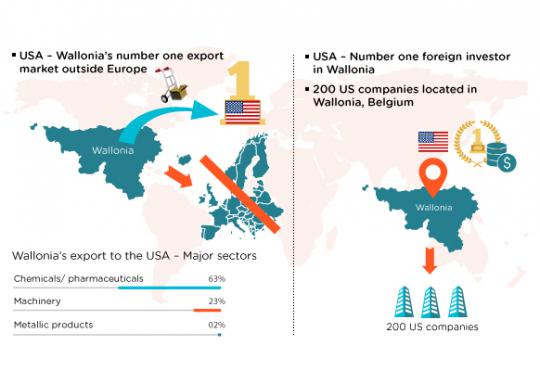
1) Exports from Wallonia to the USA
The USA holds the 3rd place in the international ranking for clients of Wallonia just behind France (1st) and Germany (2nd) and ahead of the Netherlands (4th), the United Kingdom (5th), Italy (6th), Spain (7th), Luxembourg (8th), Poland (9th) and Canada (10th).
Exports from Wallonia to the USA account for 11.92% of global Walloon exports.
In 2019, Wallonia’s exports to the USA totaled 5.85 billion euros, up 48.7% compared to 2018.
Sectors of Walloon exports to the USA
- Chemical and pharmaceutical products: 88.98%
- Machines + mechanical, electrical and electronical equipment: 5.77%
- Base metals and works thereof: 0.98%
- Weapons and ammunition: 0.60%
- Transportation equipment: 0.38%
Variation
- 2015/2014: +42.2%
- 2016/2015: -8.2%
- 2017/2016: -8.6%
- 2018/2017: +53.1%
- 2019/2018: +48.7%
2) Imports from the USA to Wallonia
The USA holds the 6th place in the international ranking for suppliers of Wallonia just behind France (1st), Switzerland (2nd), Germany (3rd), the Netherlands (4th) and Italy (5th) and ahead of the United Kingdom (7th), Japan (8th), Russia (9th) and Luxembourg (10th).
Imports from the USA to Wallonia account for 6.71% of global Walloon imports.
In 2019, Wallonia’s imports from the USA totaled 2.57 billion euros, down 8.7% compared to 2018.
Sectors of Walloon imports from the USA
- Chemical and pharmaceutical products: 50.21%
- Machines + mechanical, electrical and electronical equipment: 24.53%
- Optical instruments, precision and watchmaking tools: 11.42%
- Transportation equipment: 4.66%
- Base metals and works thereof: 4.20%
Variation
- 2015/2014: +20.9%
- 2016/2015: +10.3%
- 2017/2016: +29.9%
- 2018/2017: -0.1%
- 2019/2018: -8.7%
The trade balance by end of 2019 amounts to 3,28 billion euros in favor of Wallonia.